Horizon Cloud Service Next Gen Apis – Chapter 2

Immagine che contiene testo, Neon, Segnali luminosi, Insegna al neon Il contenuto generato dall'IA potrebbe non essere corretto.

Set Syslog settings across UAG deployments

In this second article on working with APIs in Horizon Cloud Services, we will focus on a practical, security-relevant use case: configuring Syslog on Unified Access Gateways (UAGs) deployed through Horizon Cloud.

Whether you are running Horizon Cloud Service on Microsoft Azure or Horizon Cloud Service on vSphere, centralized logging is a fundamental component of any secure and well-governed environment. Proper Syslog configuration ensures that security events, authentication logs, and operational data generated by UAG appliances are forwarded to your SIEM or log management platform for monitoring, auditing, and incident response.

Instead of performing manual configuration tasks, we will explore how to leverage Horizon Cloud APIs to automate and standardise Syslog settings across UAG deployments, improving consistency, scalability, and operational efficiency.

Now when can explain the API we need to use and how to apply the syslog configuration on UAG (In this case, I used an HCS on vSphere, the new solution where we don’t deploy the Connection Server, but we use the HCS control panel to configure Pools, Entitlements and other…)

The first step is always the authentication process; I explained how to create the API token in my previous post (Horizon Cloud Service Next Gen Apis – Chapter 1), and now I won’t explain it again.

Let’s go…..

How to show UAG information

This command displays the UAG’s information

Invoke-RestMethod -Uri https://cloud-sg.horizon.omnissa.com/admin/v2/uag-deployments Method Get -Headers $Header

 We have two UAG deployments connected to HCS, and the output displays two deployment ids:
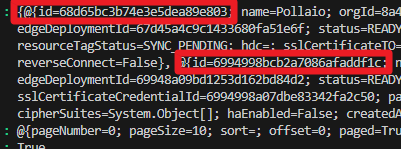
Immagine che contiene testo, schermata, Carattere Il contenuto generato dall'IA potrebbe non essere corretto.

The UAG id for HCS on vSphere is the second id.

Immagine che contiene testo, schermata, Carattere Il contenuto generato dall'IA potrebbe non essere corretto.

Now I need to recover only the UAG IDs and OrgIDs

Invoke-RestMethod -Uri https://cloud-sg.horizon.omnissa.com/admin/v2/uag-deployments -Method Get -Headers $Header | Select-Object -ExpandProperty content | Select-Object id,OrgId

Immagine che contiene testo, schermata, Carattere Il contenuto generato dall'IA potrebbe non essere corretto.

The UAG id that I need to use for identifying the deployment for HCS on vSphere is:

6994998bcb2a7086afaddf1c 

I will use this ID to associate the syslog configuration with the UAG server.


How to set the correct parameters for Syslog configuration

We need to create a Body value like this:

$Body = @{
  orgId  = "8a4931b3-e6ac-44bf-9d25-723f4119e46f"
  projectId = "Pollaio-Project"
  name = "Pollaio-Configuration2"
  syslogEventCategory = "ALL_EVENTS"
  syslogServerProtocolSettingsCreateTO = @{
    sourceToSyslogServerProtocol = "TCP"
  }
  syslogFormat = "TEXT"
  syslogURI = "192.168.111.223:514"
  includeSystemMessages = $true
  sources = @(
    @{
      type = "UAG"
      id   = "6994998bcb2a7086afaddf1c"
    }
  )
}

.

Where:

Value Description Accept value
OrgID It is the OrgId that we recovered with the previous command String
ProjectId ID of theCSP project that owns this data String
Name User defined name of the syslog server configuration String
SyslogEventCategory Events sent from the UAG appliance to the syslog server [ ALL_EVENTS, AUDIT_EVENTS ]
sourceToSyslogServerProtocol The protocol used to send data from the UAG appliance to the syslog server [ UDP, TCP, TLS, MQTT ]
syslogFormat [ JSON_TITAN, TEXT ]
syslogURI Syslog server URI String
includeSystemMessages If true, system messages are sent to the syslog server [ $True]
sources

List of sources associated with the syslog server:

Type = Source for the syslog server. For es: UAG

Id = Id of the source associated with the syslog server (The Id value that we recovered with the previous command


.

.

How to set the configuration for UAG
$Body = @{
  orgId  = "8a4931b3-e6ac-44bf-9d25-723f4119e46f"
  projectId = "Pollaio-Project"
  name = "Pollaio-Configuration2"
  syslogEventCategory = "ALL_EVENTS"
  syslogServerProtocolSettingsCreateTO = @{
    sourceToSyslogServerProtocol = "TCP"
  }
  syslogFormat = "TEXT"
  syslogURI = "192.168.111.223:514"
  includeSystemMessages = $true
  sources = @(
    @{
      type = "UAG"
      id   = "6994998bcb2a7086afaddf1c"
    }
  )
}

#Convert Body to JSON
$JsonBody = $Body | ConvertTo-Json -Depth 5
#Send POST request to create Syslog Server UAG configuration
Invoke-RestMethod -Uri https://cloud-sg.horizon.omnissa.com/admin/v1/syslog-server -Method Post -Headers $Header -Body $JsonBody
HOW to check SYSLOG Configuration on UAG deployment


Invoke-RestMethod -Uri https://cloud-sg.horizon.omnissa.com/admin/v1/syslog-server -Method Get -Headers $Header

The command output is like this:

.

 Now I can see in my SYSLOG server the UAG Log
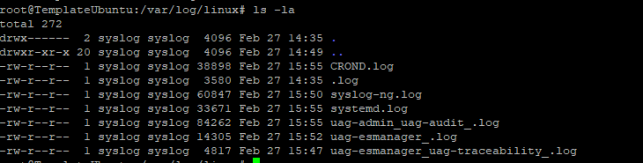
Immagine che contiene testo, schermata, Carattere Il contenuto generato dall'IA potrebbe non essere corretto.

.

.

.

Horizon Cloud Service Next Gen Apis – Chapter 2

Logs Don’t Lie: Why You Need Syslog Enabled on Omnissa Access SaaS

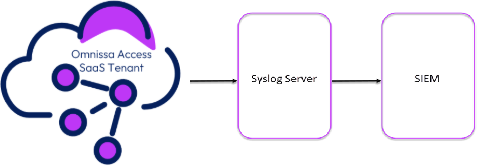
A diagram of a server AI-generated content may be incorrect.

If you’re running Omnissa Access SaaS and you haven’t enabled syslog yet, here’s your gentle-but-firm nudge: do it now. No, seriously. Your SIEM is hungry, and syslog is the buffet.

Let’s dig into why syslog matters, and how you can set it up in less time than it takes to reboot a stubborn printer.

.

Why Should I Enable Syslog?

You might think, “Access logs are already there in the console. Isn’t that enough?”
Short answer:
Nope.

Longer answer:

• Centralized Security Monitoring: Syslog lets you push logs to a SIEM (like Splunk or SYSLOG, I suppose that Omnissa increases the supported SIEM), helping you detect anomalies like brute force attacks, unusual login patterns, or rogue authentication attempts.
• Compliance & Auditing: GDPR, ISO 27001, HIPAA — they all love detailed, timestamped logs.
• Operational Insight: Know exactly who did what, where, and when — across all your users and apps.
• Forensics & Troubleshooting: Ever tried to investigate a login issue without logs? Exactly.

.

What Events Can I Capture?

Omnissa Access can emit audit events, system events, user authentication, and admin actions. Think:

• User logins (successful & failed)
• Policy evaluations
• App launches
• Admin config changes (Policies, Rule etc.)

All this, neatly packaged as syslog messages you can parse, alert on, or just hoard like a proper security engineer.

.

How to Enable Syslog in Omnissa Access SaaS

Requirement

–TLS connection
–Expose to internet our syslog or SIEM. (For now it is only possible configuration, OK this are a point of attention for the Security… but you can manage with firewall rule and other configuration to increase the security)

Setting up syslog in Omnissa Access SaaS is surprisingly painless.

1.Login to the Omnissa Access SaaS Admin Console
Navigate to the
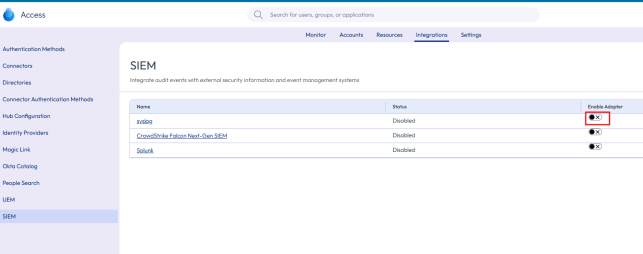
Integrations section in the Omnissa Access SaaS Admin UI.
2.Go to SIEM
You’ll find the syslog settings under
SIEM

A screenshot of a computer AI-generated content may be incorrect.

3.Enable Syslog Forwarding
Toggle it
on, and enter your syslog destination (IP or FQDN), port, and protocol (TCP or UDP).

A screenshot of a computer AI-generated content may be incorrect.

Where

◦ Appname

A tag appends to the syslog raw

◦ Chose Facility
◦ Choose the Severity
Select which log levels
◦ Hostname
Currently the syslog server needs to be published on the internet (this might cause some headaches) in order for the Access SaaS solution to be able to send logs.
◦ TCP Port
◦ Client Certificate
◦ Client Private Key
◦ Syslog Certificate
4.Save & Monitor
Save your settings and check your syslog server for incoming logs. A quick
tcpdump or tail on your syslog endpoint can help confirm delivery.

.

Bonus Tip: Test It!

Try logging in as a test user, change a policy, or simulate a failed login — and watch the logs roll in. If your SIEM lights up, congrats — you’ve just levelled up your visibility game.

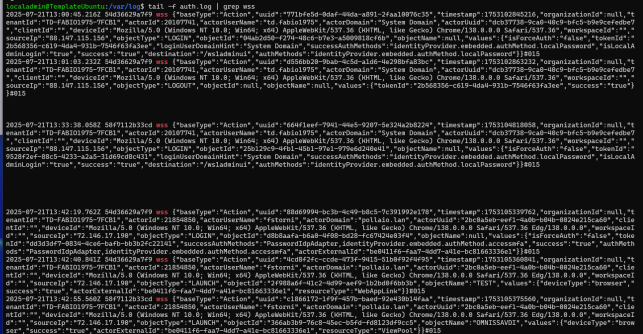
My syslog, in this case for the test, is a normal RSYSLOG installed on UBUNTU OS.

I can see a lot of information:

A screen shot of a computer screen AI-generated content may be incorrect.

Where can we see this action:

–LOGIN (Failed or Successful) -> Administrator account or user account and the type of login (MFA/Local Password …)
–LAUNCH -> Application launched and the name of the application/VDI.
–LOGOFF

And many other information like configuration changes, deleted or viewed objects (such as policies).

.

Pro Tips

• TCP with TLS over UDP for reliable, encrypted delivery. (it is a requirement)
• Use log tagging or filtering on the SIEM side to categorise Omnissa logs separately.
• Integrate with alerting tools like PagerDuty or Slack for real-time reactions.

.

🏁 Final Thoughts

Syslog isn’t just for compliance checkboxes — it’s your window into what’s happening inside Omnissa Access. Whether you’re defending against intrusions or just troubleshooting a login issue on a Friday at 5 PM, you’ll thank yourself for turning it on.

So go ahead — feed your SIEM. You know it’s hungry. 🍽️

.

Logs Don’t Lie: Why You Need Syslog Enabled on Omnissa Access SaaS

Ingest your VMware ESXi logs into Azure Sentinel

The VMware ESXi connector is currently in PREVIEW

What is Azure Sentinel?

Microsoft Azure Sentinel is a scalable, cloud-native, security information event management (SIEM) and security orchestration automated response (SOAR) solution. Azure Sentinel delivers intelligent security analytics and threat intelligence across the enterprise, providing a single solution for alert detection, threat visibility, proactive hunting, and threat response.

Azure Sentinel ingests data from services and apps by connecting to the service and forwarding the events and logs to Azure Sentinel. For physical and virtual machines, you can install the Log Analytics agent that collects the logs and forwards them to Azure Sentinel. For Firewalls and proxies, Azure Sentinel installs the Log Analytics agent on a Linux Syslog server, from which the agent collects the log files and forwards them to Azure Sentinel.
How connect  VMware ESXi to Azure Sentinel?

Integration between VMware ESXi and Azure Sentinel makes use of a Syslog server with the Log Analytics agent installed. It also uses a custom-built log parser based on a Kusto function.

For the onboarding of ESXi on Azure Sentinel, these are the step:

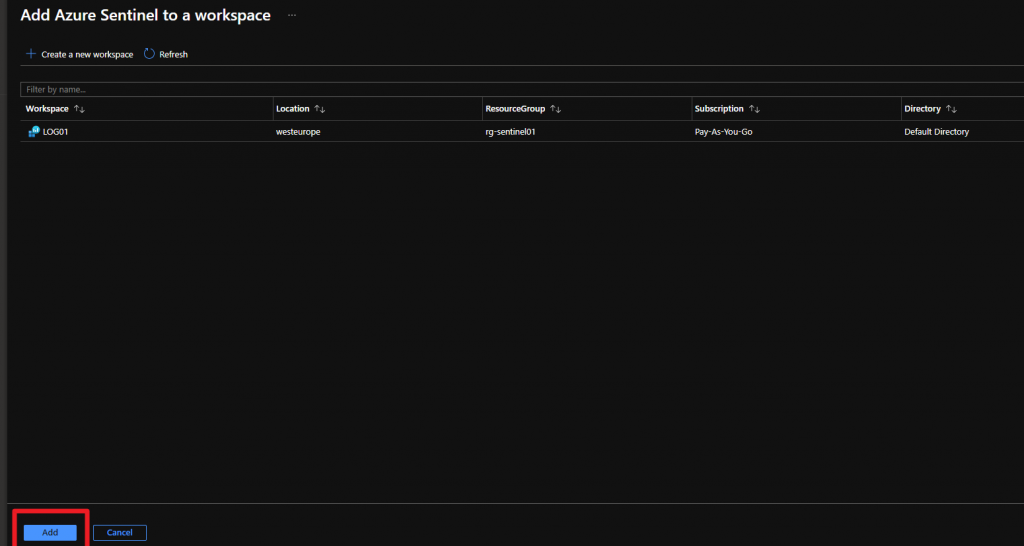
  • Have up and running a  Azure Sentinel service.
  • Prepare a Linux Syslog Server
  • Install Log Analytics Agent
  • Create the VMwareESXi Kusto function
  • Configure your ESXi Hosts to forward log to Syslog server

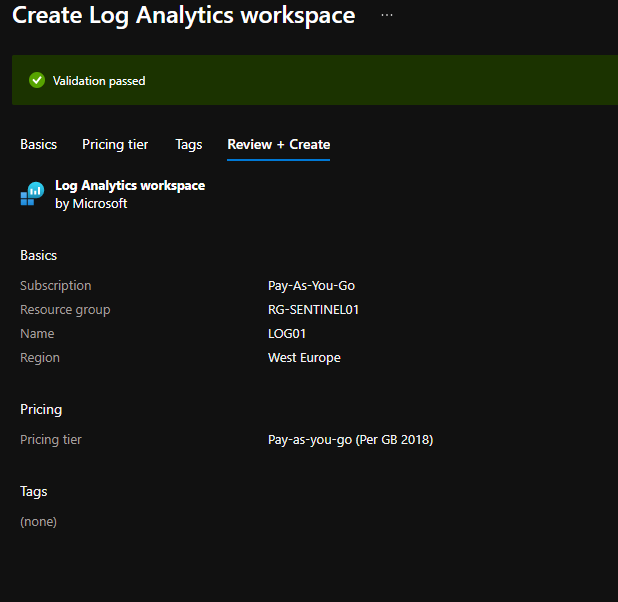
Create a Azure Sentinel Service 

This example is related to a basic configuration of the Azure Sentinel infrastructure, for more information and details for sizing and costs check in the respective guides from Microsoft.

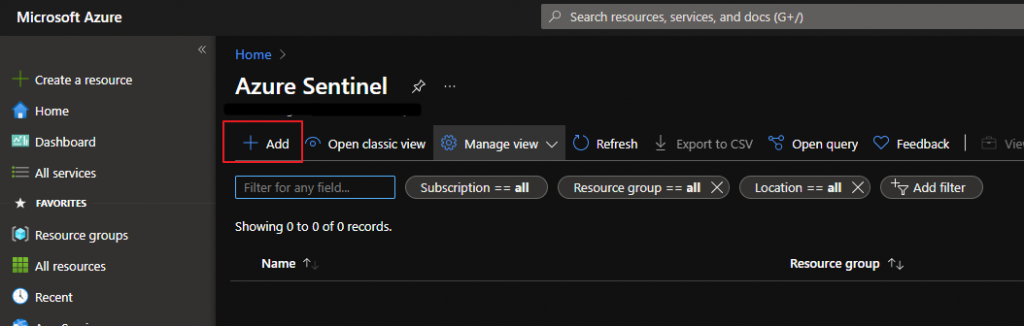
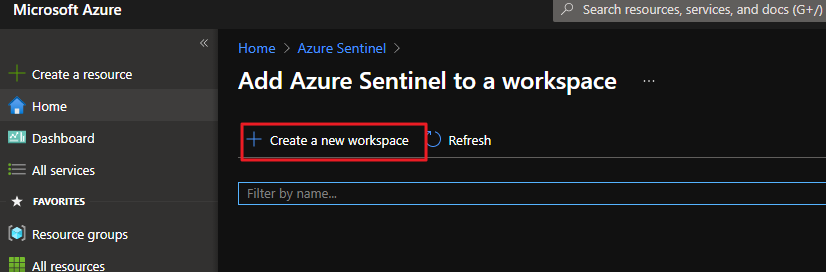
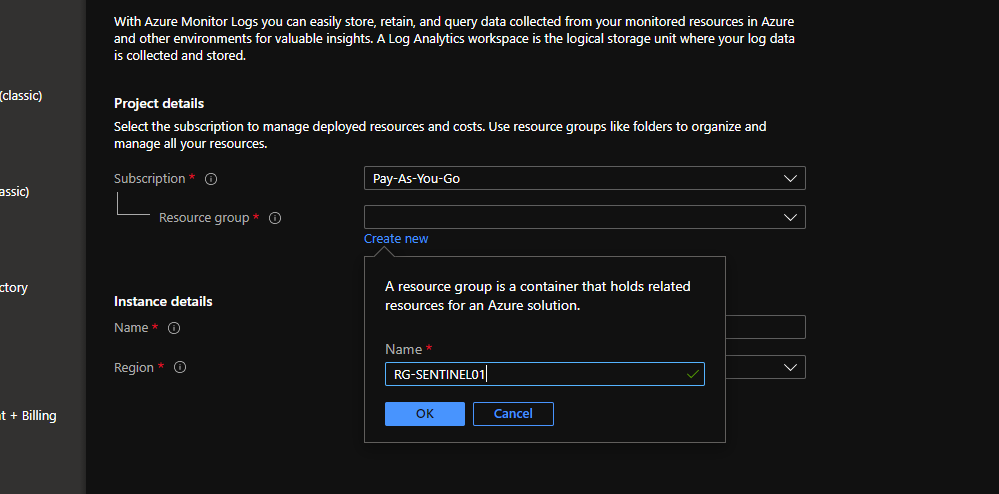
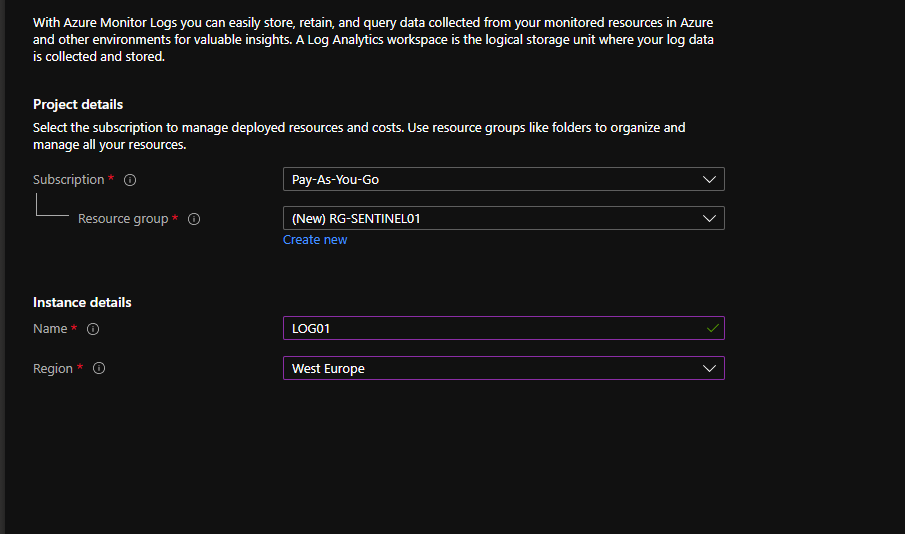
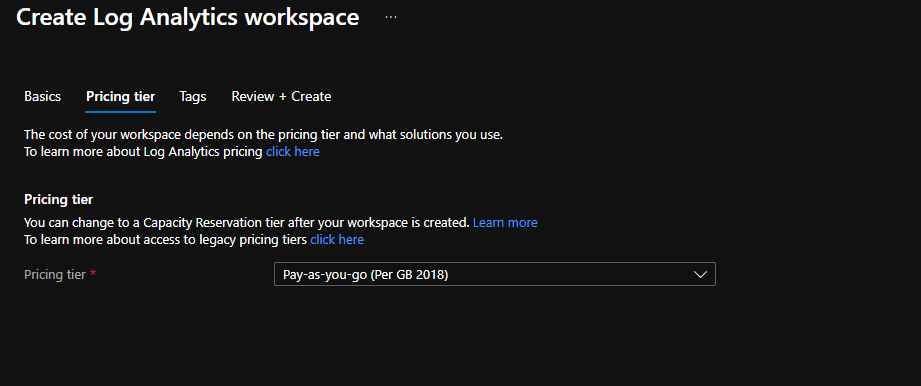
Login to Azure Portal (How to get an Azure subscription?)

Prepare Linux Syslog

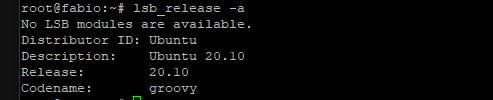
I have installed a virtual machine with Ubuntu Guest OS

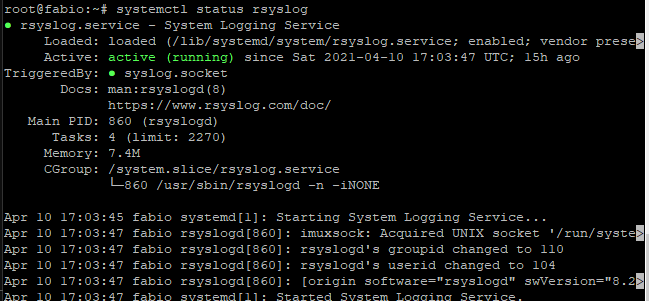
I have checked if rsyslog is installed and running

if rsyslog is not installed run the following installation command

 apt-get install rsyslog

Configure rsyslog

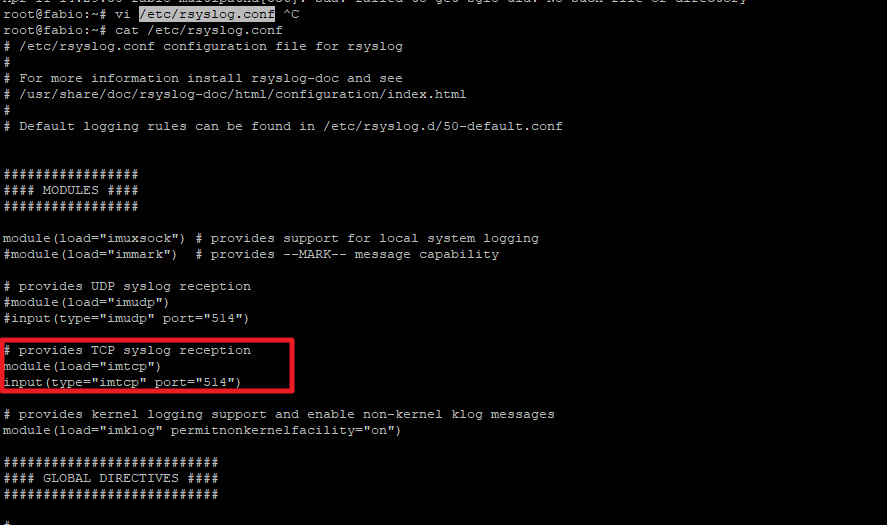
Verify the tcp port used from syslog server

Cat  /etc/rsyslog.conf

Configure Kusto function alias

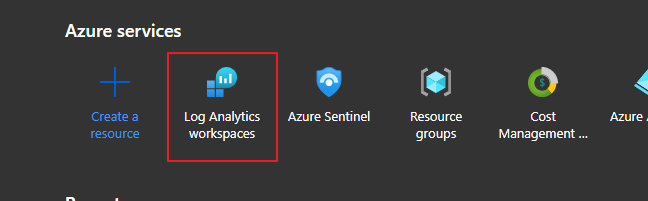
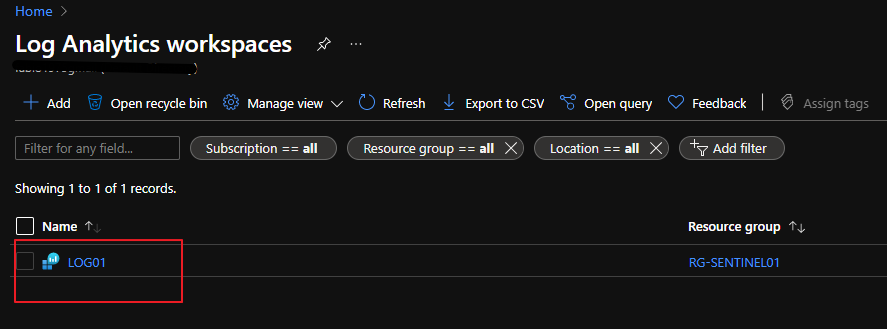
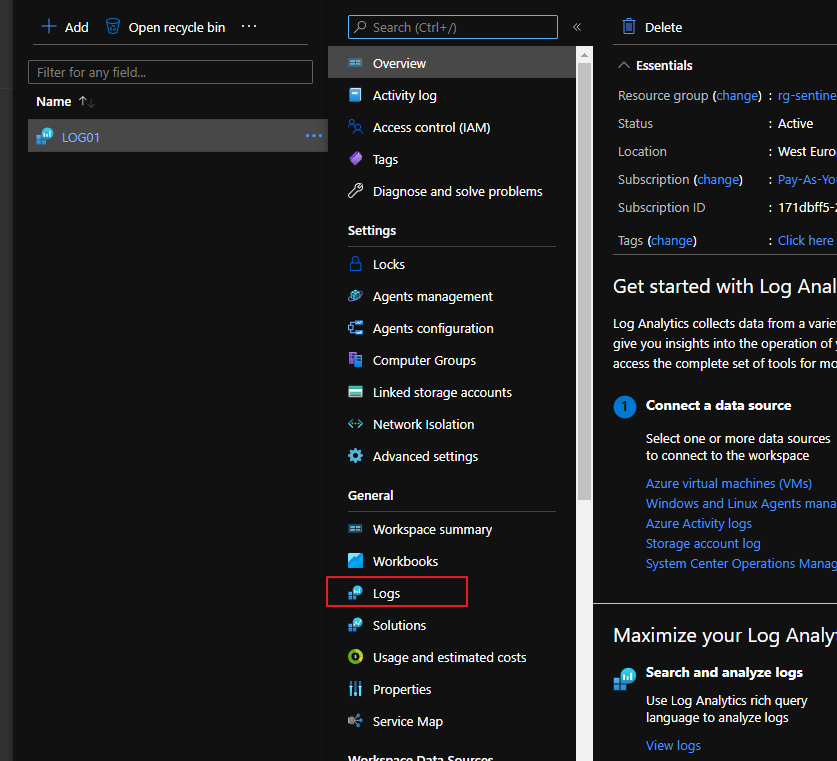
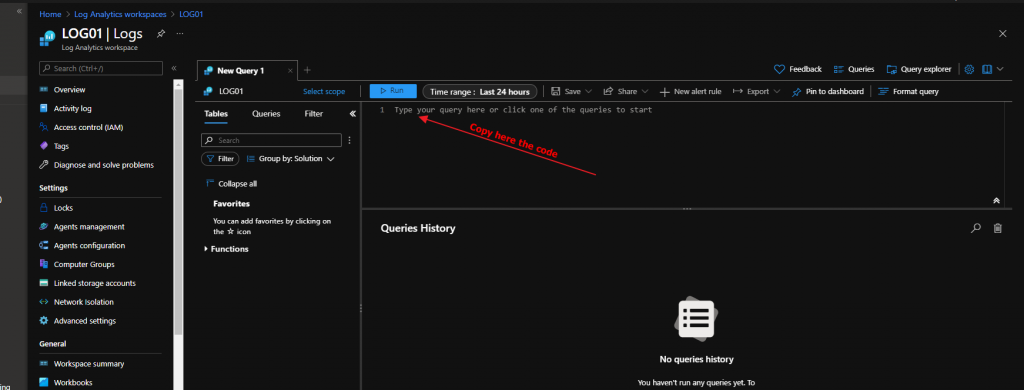
On log analytics workspace

 create this function:

/ Title:           VMWare ESXi
// Author:          Microsoft
// Version:         1.0
// Last Updated:    11/13/2020
// Comment:         Inital Release
//  
// DESCRIPTION:
// This parser takes raw VMWare ESXi logs from a Syslog stream and parses the logs into a normalized schema.
//
// USAGE:
// 1. Open Log Analytics/Azure Sentinel Logs blade. Copy the query below and paste into the Logs query window. 
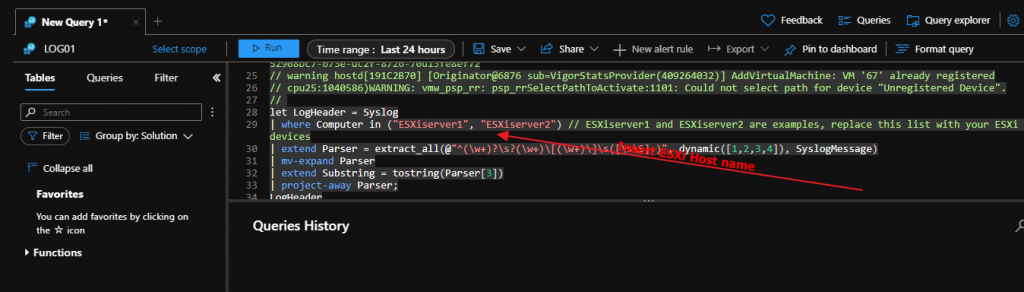
// 2. In the query window, on the second line of the query, enter the hostname(s) of your VMWare ESXi device(s) and any other unique identifiers for the logstream. 
//    For example: | where Computer in ("server1", "server2")
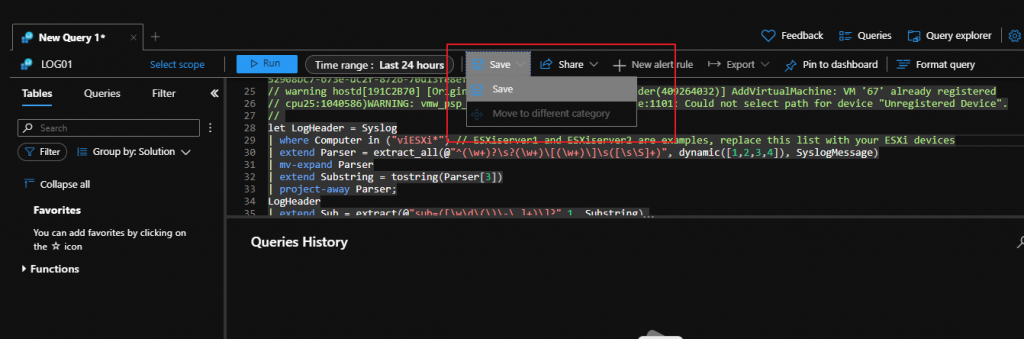
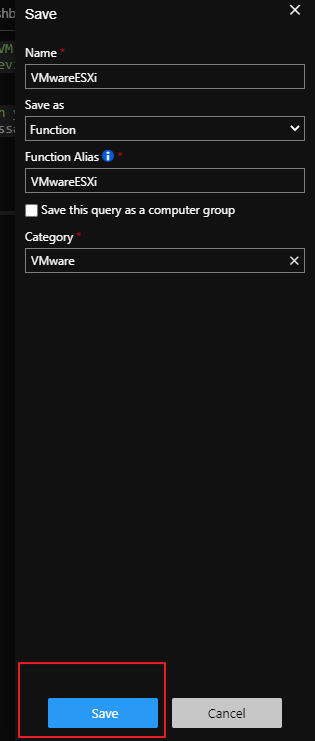
// 3. Click the Save button above the query. A pane will appear on the right, select "as Function" from the drop down. Enter a Function Name.
//    It is recommended to name the Function Alias, as VMwareESXi
// 4. Kusto Functions can typically take up to 15 minutes to activate. You can then use Function Alias for other queries.
//
// REFERENCES: 
// Using functions in Azure monitor log queries: https://docs.microsoft.com/azure/azure-monitor/log-query/functions
// 
// LOG SAMPLES:
// This parser assumes the raw log are formatted as follows:
//
// info vpxa[D089B70] [Originator@6876 sub=vpxLro opID=HB-host-89929@3678594-5d55f348-40] [VpxLRO] -- BEGIN session[52908bc7-673e-dc2f-8726-70d13fe8ef72]521881cd-707e-cf9b-01c4-f0fd16d7444d -- vpxa -- vpxapi.VpxaService.retrieveChanges -- 52908bc7-673e-dc2f-8726-70d13fe8ef72
// warning hostd[191C2B70] [Originator@6876 sub=VigorStatsProvider(409264032)] AddVirtualMachine: VM '67' already registered
// cpu25:1040586)WARNING: vmw_psp_rr: psp_rrSelectPathToActivate:1101: Could not select path for device "Unregistered Device".
// 
let LogHeader = Syslog
| where Computer in ("ESXiserver1", "ESXiserver2") // ESXiserver1 and ESXiserver2 are examples, replace this list with your ESXi devices
| extend Parser = extract_all(@"^(\w+)?\s?(\w+)\[(\w+)\]\s([\s\S]+)", dynamic([1,2,3,4]), SyslogMessage)
| mv-expand Parser
| extend Substring = tostring(Parser[3])
| project-away Parser;
LogHeader
| extend Sub = extract(@"sub=([\w\d\(\)\-\.]+)\]?",1, Substring),
	 OpId = extract(@"opID=([\w\d\(\)\-@]+)\s?\]?",1, Substring),
         UserName = extract(@"\suser=([\w\d\(\)\-]+)\]",1, Substring)
| extend Message = extract(@"\[([\S\s]+)\]\s([\S\s]+)",2, Substring)
| extend Message = iif(isempty(Message),SyslogMessage,Message)
| extend Message = trim(@"^-- ", Message)
| project-away Substring

Install Log Analytics Agent

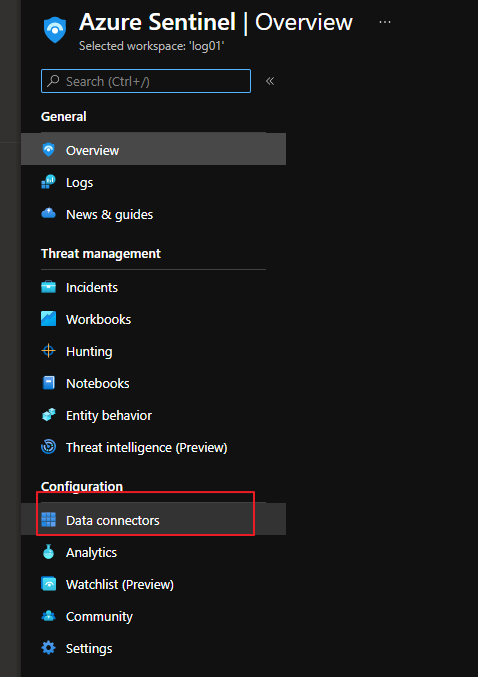
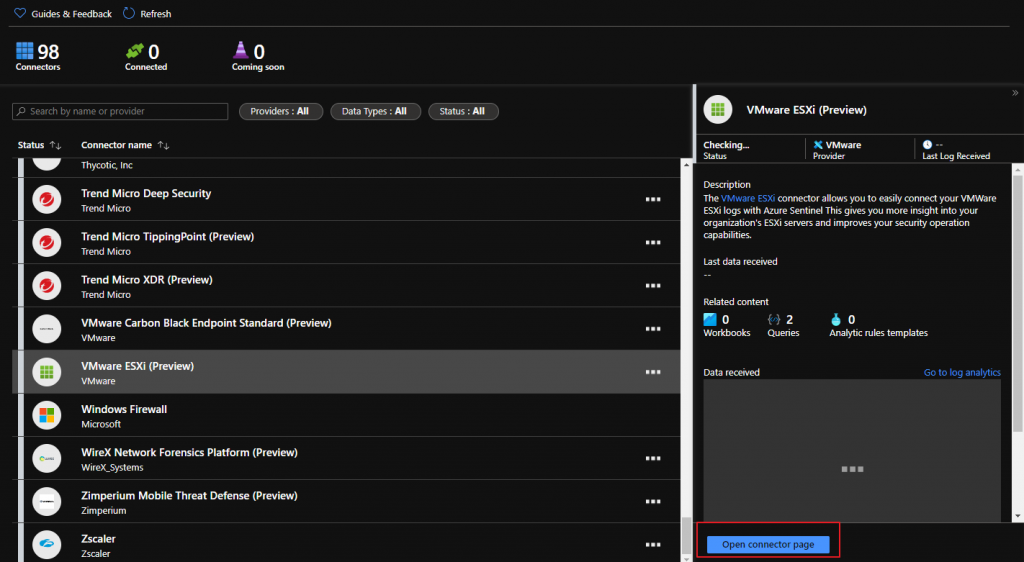
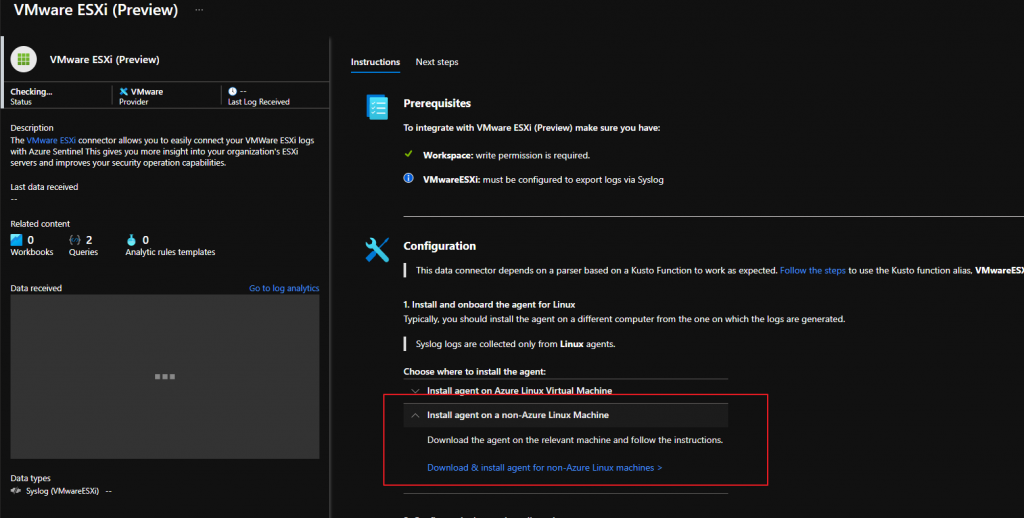
Go to Vmware ESXi Connector on Azure Sentinel

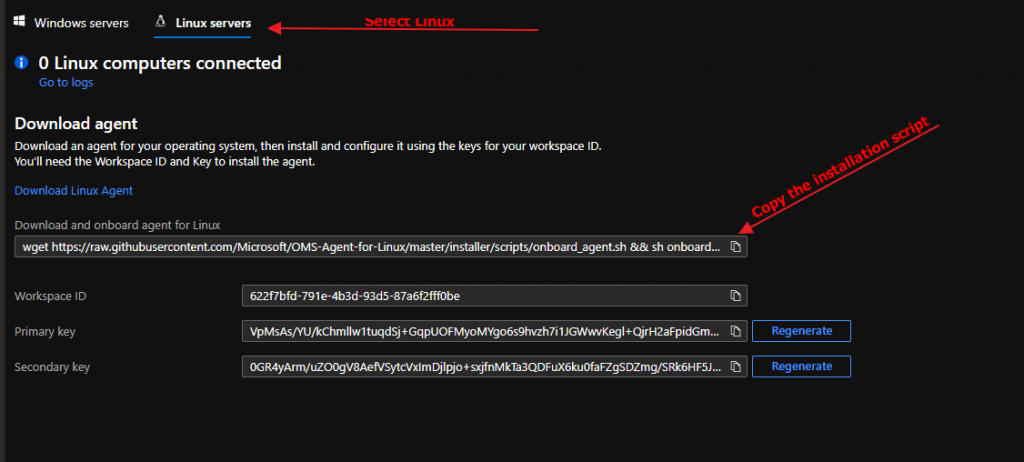
Go to linux syslog server and paste it the code for onboard agent to sentinel

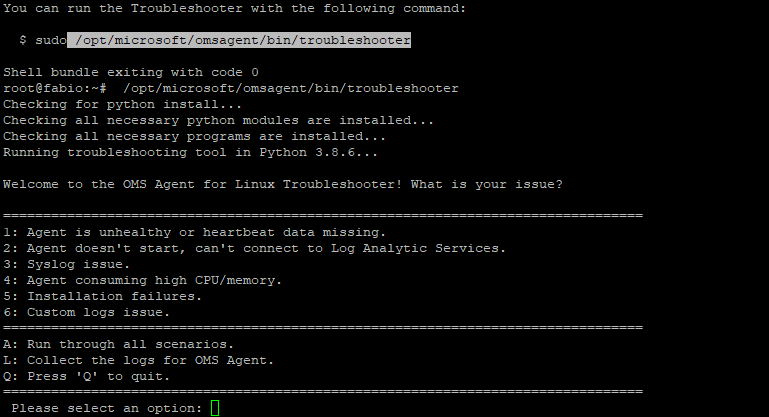
For troubleshooting

/opt/microsoft/omsagent/bin/troubleshooter

In my installation was missing :

And i have installed it

apt-get install gdb

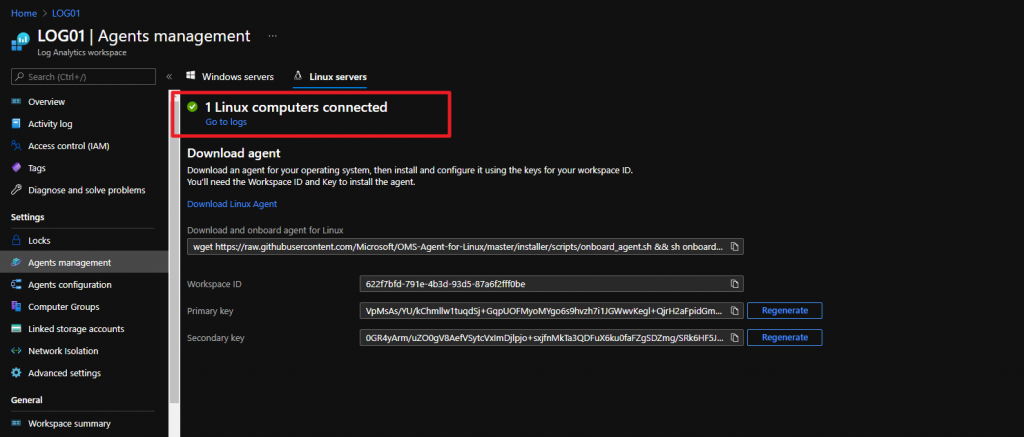
If the installation is ok

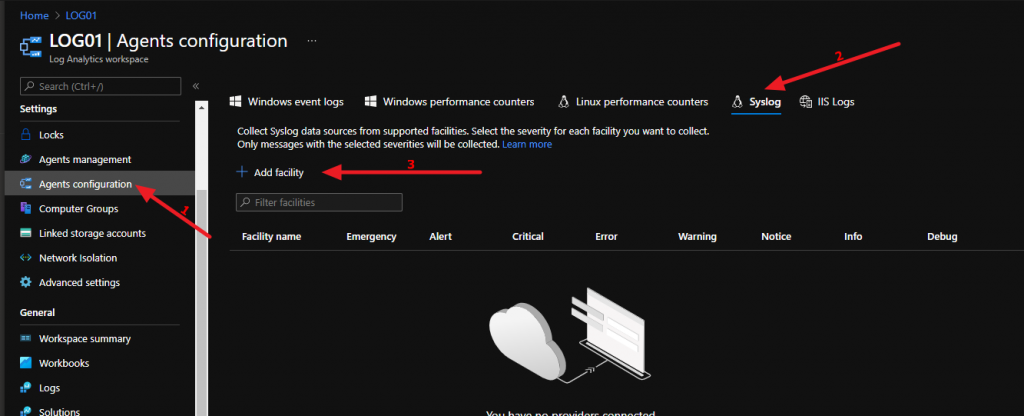
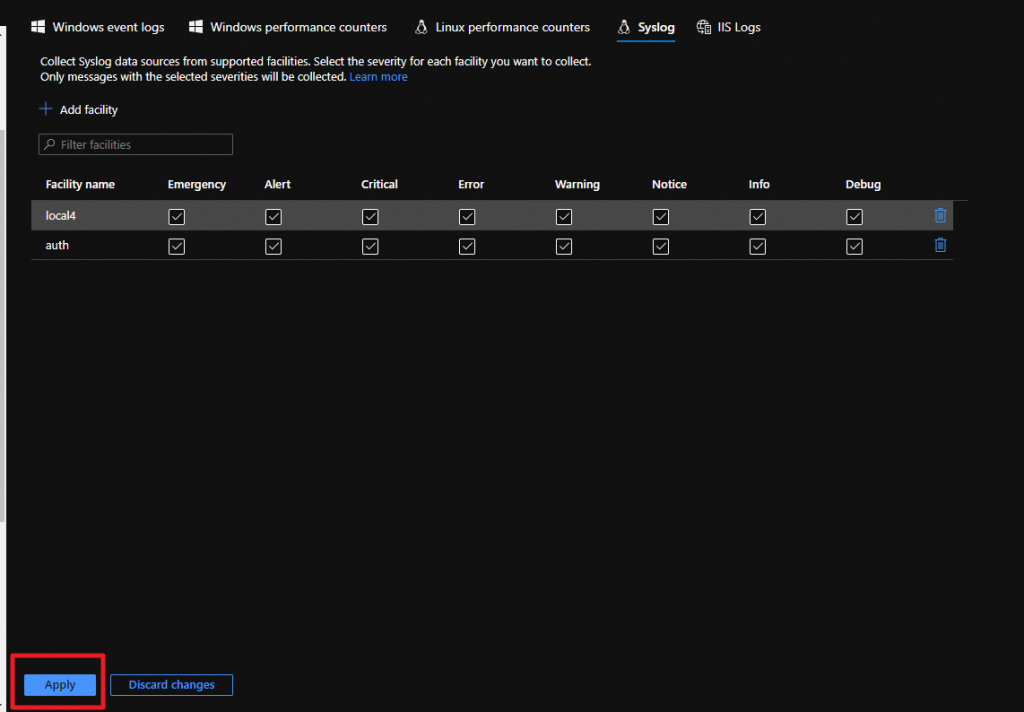
now we set which logs the linux agent must send to our workspace

And add local4 e auth

automatically this information will be sent to our agent

Configure ESXi to send data to Linux Syslog Gateway (Where is installed the Log Analytics Agent)

We configure our esxi hosts to send logs to our linux syslog with this powercli script:

Connect-ViServer 
$vmHosts = Get-VMHost
$remoteSyslog = 'tcp://<linuxlogserver>'
$syslogport = '514'
# Show current config
$vmHosts | ForEach-Object {
    Write-Host $_.Name
    Get-VMHostSysLogServer -VMHost $_
}
# Set syslog config in hypervisors
$vmHosts | ForEach-Object {
    Write-Host $_.Name
    Set-VMHostSysLogServer -SysLogServer $remoteSyslog":"$syslogPort -VMHost $_
}
# Restart syslog and set the allow rules in the ESXi
$vmHosts | ForEach-Object {
    Write-Host $_.Name
    (Get-Esxcli -v2 -VMHost $_).system.syslog.reload.Invoke()
    (Get-Esxcli -v2 -VMHost $_).network.firewall.ruleset.set.Invoke(@{rulesetid='syslog'; enabled=$true})
    (Get-Esxcli -v2 -VMHost $_).network.firewall.refresh.Invoke()
}
# Show current config
$vmHosts | ForEach-Object {
    Write-Host $_.Name
    Get-VMHostSysLogServer -VMHost $_
}

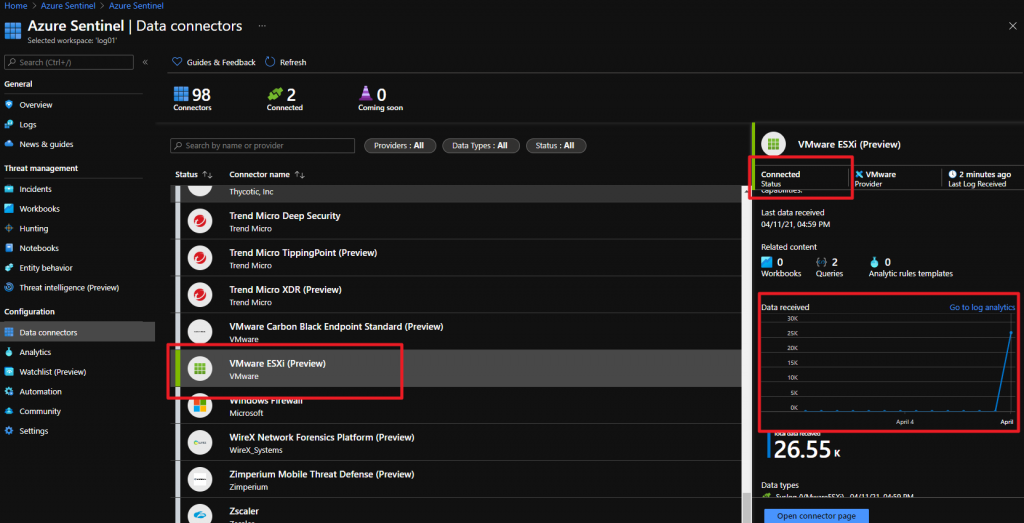
Check if ESXi Sentinel Connector is UP

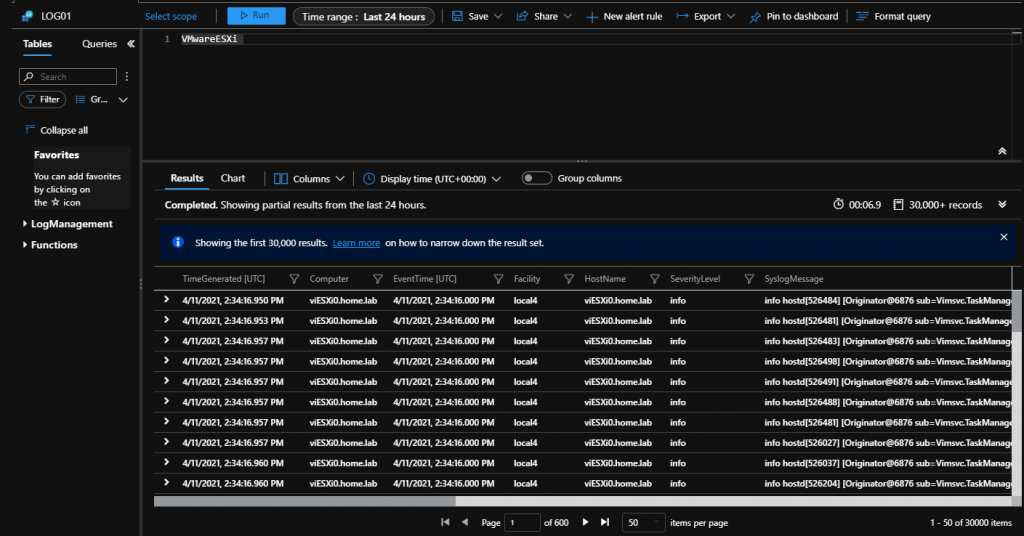
Query to view log

Ingest your VMware ESXi logs into Azure Sentinel